data collection
data presentation
data collection
data presentation
The data collection is done by a special program that is implemented as a socalled PROFILE tool. The profile tool DRA is activated by means of the Language Environment runtime option PROFILE. This is an official interface managed by Language Environment who fires PROFILE events at certain strategic moments such as initiation and termination of the application program. Events are also fired during execution of the application program, for instance, when a DLL is being loaded and initialized. In addition, DRA intercepts callable LE services as well as calls to functions that are part of the application program itself. These events enable DRA to monitor the activities of the application program as it is executing. The data collected during these events is written to the LE message file.
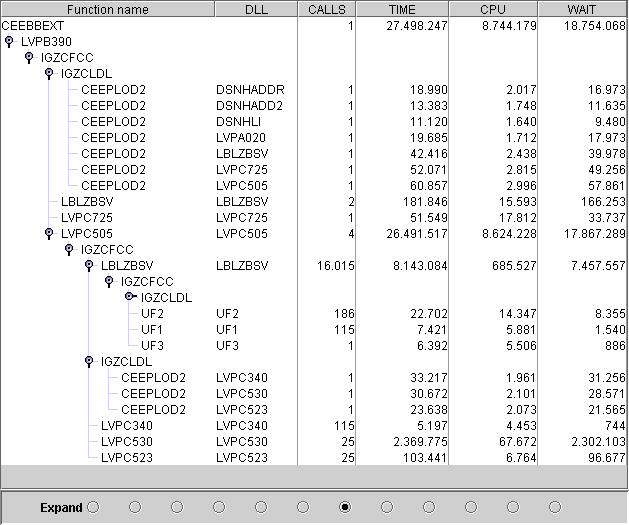
The data presentation is done by a separate program that reads the data from the LE message file. This is a cross-platform Java program that presents the data in a socalled "tree table". The Java program runs on the Windows platform as a double-clickable application. The message file needs to be FTP'ed from OS/390 or z/OS to Windows.
The data about each function (if available) is shown in separate columns:
Column NAME shows the name of the function.
Column DLL shows the name of the load module or DLL (if applicable)
Column CALLS shows how often the function was called.
Column TIME shows the total elapsed clock time (microsecs) used by the function.
Column CPU shows the total cpu time (microsecs).
Column WAIT shows the total wait time (microsecs).
The functions names are socalled "nodes" of the Java tree. These nodes represent the calling hierarchy relative to the root node, which is usually the main function. Each node has a handle with which it can be expanded or collapsed, thus enabling the user to inrease or decrease the depth of detail as desired. When a particular function has not called any other functions then it doesn't have a handle either. Such a function is called a "leaf".